
Average Shopify Conversion Rate (and How to Beat It)
On this page
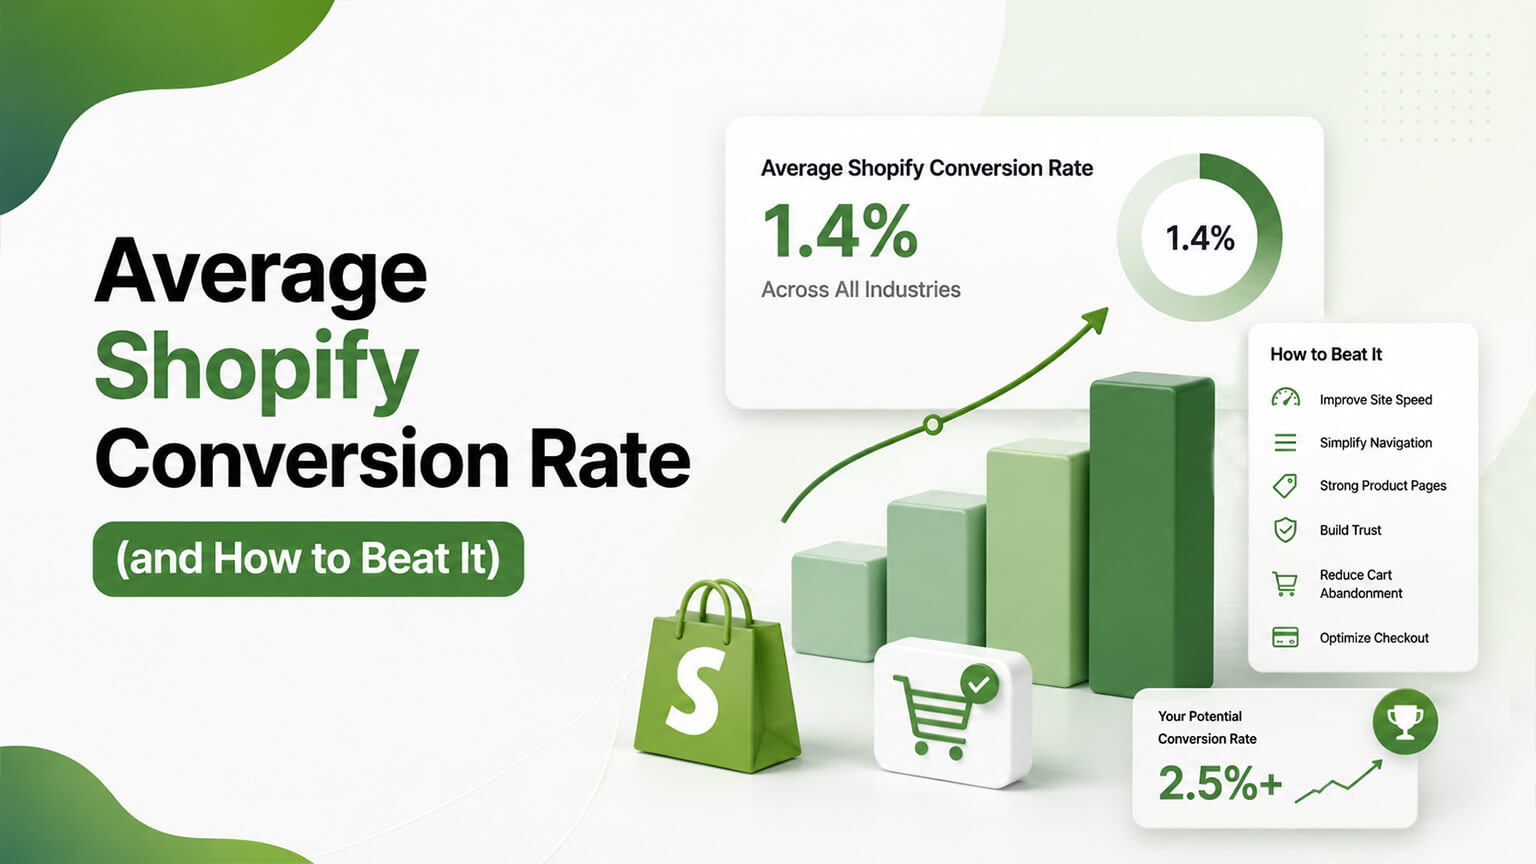
“What’s a good conversion rate?” is one of the most common questions ecommerce store owners ask, usually hoping for a benchmark number to compare themselves against. The honest answer is more nuanced than a single figure: conversion rates vary enormously by industry, product type, price point, traffic source and quality, audience, and store maturity, so a “good” rate for one store can be poor for another — and generic benchmark numbers (often cited as ecommerce averaging somewhere in the low single digits) are of limited use for judging your specific store. What matters far more than comparing to a generic average is understanding your own conversion rate, its context, and how to improve it over time. So this piece addresses the benchmark question honestly (what averages mean and don’t), then focuses on what’s actually useful: how to think about your own conversion rate and, more importantly, how to beat it — improving your own conversion over time, which is what grows your business. (This connects to the CRO-guide and metrics discussions; this focuses on conversion-rate benchmarks and improvement.)
This piece covers what the “average conversion rate” means (and its limits), why your own rate and context matter more, how to judge your conversion rate sensibly, and how to beat it (improve your own). Because the benchmark question is common but the benchmark answer is limited, and improving your own rate is what matters. Let me walk through it.
What the “average conversion rate” means (and its limits)
Let’s address the benchmark honestly. The commonly-cited averages — ecommerce conversion rates are commonly cited as averaging somewhere in the low single digits (often quoted around 2-3%, though figures vary by source and change over time), with “good” sometimes cited as higher — the kind of benchmark people seek. But averages vary enormously — actual conversion rates vary hugely by many factors: industry and product type (some products convert far higher or lower than others), price point (high-priced or considered purchases convert lower than cheap impulse buys), traffic source and quality (high-intent traffic like branded search or email converts far higher than cold or broad traffic like top-of-funnel ads or social), audience, device (mobile often converts lower than desktop, as the mobile-CRO discussion covers), store maturity and brand strength, and more — so “average” spans a wide range, and a single benchmark number obscures this variation. Comparing to a generic average is of limited use — because of this variation, comparing your rate to a generic ecommerce average tells you little: your “right” rate depends on your specific factors, so a generic average isn’t a meaningful target for your specific store (you might have a “low” rate that’s actually good for your context, or a “high” rate that’s underperforming your potential). Benchmarks can mislead — relying on generic benchmarks can mislead: feeling good about beating an average (when you’re underperforming your potential) or bad about being below it (when you’re doing well for your context) — both misjudgments from a meaningless comparison. Context-specific benchmarks are more useful — more useful than generic averages are context-specific comparisons: your rate versus similar stores/industries (if you have such data), your rate by segment (channel, device — comparing your own segments), and especially your rate over time (versus your own past) — these contextual comparisons are more meaningful than a generic average. So the “average conversion rate” (commonly cited in the low single digits) is of limited use because rates vary enormously by industry, product, price, traffic quality, audience, device, and maturity, so a generic average isn’t a meaningful target for your specific store and can mislead — while context-specific comparisons (similar stores, your own segments, and especially your own rate over time) are more useful. So don’t fixate on beating a generic average; understand your own rate in context, which the next section covers. So take benchmark numbers with skepticism, and focus on your own rate and its improvement.

Why your own rate and context matter more
What matters more than the generic average is your own conversion rate in its context. Your rate reflects your specifics — your conversion rate reflects your specific store, products, price point, traffic, audience, and execution, so it’s meaningful in your context (versus a generic average that doesn’t reflect your specifics) — understanding your rate in your context is what’s useful. Your context determines your “right” rate — your “good” rate depends on your context (a considered high-priced purchase from broad traffic will have a lower rate than a cheap impulse buy from high-intent traffic, and both can be “good” for their context), so judge your rate against your context, not a generic number. Improvement is what matters — what grows your business is improving your own conversion rate over time (converting more of your traffic, as the CRO-guide discussion covers), which is meaningful regardless of the absolute number or generic average — so your rate’s trajectory (improving?) matters more than its comparison to an average. Segment context reveals more — your rate by segment (channel, device, new vs. returning) reveals more than an overall number: which segments convert well or poorly (e.g., mobile underperforming, or a channel converting poorly), pointing to where to improve (as the GA4 discussion covers) — segment context is actionable. Your potential matters — what matters is your rate versus your potential (how much better it could be with improvement), not versus an average — a rate that’s “high” versus average might still be far below your potential (leaving money on the table), while a “low” rate might be near your potential for a hard-to-convert context. So focus on your improvement potential. And it’s about your business, not comparison — ultimately, conversion optimisation is about improving your business (more sales from your traffic), which is about your own rate and its improvement, not comparing to others — so focus there. So your own rate and context matter more than the generic average because your rate reflects your specifics, your context determines your “right” rate, improving your own rate over time is what grows your business, segment context is actionable, your rate versus your potential matters (not versus an average), and it’s ultimately about your business. So understand and focus on your own conversion rate in context (and its improvement), not a generic benchmark. The next section covers judging your rate sensibly.
How to judge your conversion rate sensibly
To judge your conversion rate sensibly (versus fixating on a generic average), do a few things. Measure it accurately — measure your conversion rate accurately (via GA4 ecommerce tracking, as that discussion covers), including overall and by segment, so you have accurate data (misconfigured tracking gives wrong rates). Look at it by segment — look at your conversion rate by segment (channel/source, device, new vs. returning, key landing pages), since segment rates reveal far more than the overall number (which segments convert well or poorly, where the opportunities are) — the most useful view for improvement. Compare to your own history — compare your rate to your own history (is it improving, stable, declining over time?), the most meaningful comparison (your own trajectory), showing whether your efforts are working. Use context-appropriate expectations — set context-appropriate expectations (understanding that your rate’s “right” level depends on your traffic quality, product, price, etc.), so you judge it sensibly (not against an inappropriate generic average). Consider traffic quality — consider your traffic quality and mix (high-intent vs. broad traffic converts very differently), since your rate is heavily influenced by traffic quality — a “low” rate might reflect broad/low-intent traffic (improvable via traffic quality or conversion), not just site conversion. Focus on the improvable — focus on what’s improvable: the segments, pages, and funnel stages where conversion is lost and could be improved (as the CRO-guide and GA4 discussions cover), which is actionable, versus fixating on the overall number vs. an average. And don’t obsess over the absolute number — don’t obsess over the absolute conversion-rate number (or its comparison to an average); focus on understanding it in context and improving it. So judge your conversion rate sensibly by measuring it accurately (overall and by segment), looking at it by segment (the most useful view), comparing to your own history (your trajectory — the most meaningful comparison), using context-appropriate expectations, considering your traffic quality, focusing on what’s improvable, and not obsessing over the absolute number versus an average. This sensible judgment — your rate in context, by segment, over time, focused on improvement — is far more useful than comparing to a generic benchmark. So judge your rate this way, understanding it meaningfully. The next section covers how to beat it (improve).
How to beat it (improve your own rate)
“Beating the average” is the wrong frame; beating your own rate (improving it over time) is the right one, and it’s done through CRO (as the CRO-guide discussion covers). Do systematic CRO — improve your conversion rate through systematic CRO (as that discussion covers): measure and understand where conversion is lost (funnel, segments), research the barriers (analytics, heatmaps, feedback), hypothesise, prioritise, test, and iterate — the systematic process that reliably improves conversion. This is how you beat your own rate. Find and fix your barriers — focus on your specific conversion barriers (revealed by your data and research — where your visitors drop off, which segments underperform), fixing them (improving product pages, checkout, trust, speed, mobile, findability, as those discussions cover) — improving your own conversion by addressing your own barriers. Improve the high-impact areas — improve the high-impact areas (product pages where buying decisions happen, cart/checkout where intent converts, trust, mobile, as the CRO-guide discussion covers), which tend to yield the most conversion improvement. Optimise by segment — optimise your underperforming segments (e.g., if mobile converts poorly, improve mobile conversion, as the mobile-CRO discussion covers), lifting the segments dragging your rate. Improve traffic quality too — recognise that conversion rate also depends on traffic quality, so improving your traffic quality/mix (attracting more high-intent traffic) can raise your rate alongside site conversion improvements (a related lever). Test and measure — test your improvements and measure their effect on conversion (as the A/B-testing and GA4 discussions cover), validating that you’re actually improving your rate. And keep iterating — keep iterating (continuous CRO, as that discussion covers), since beating your own rate is an ongoing process of continual improvement, not a one-time fix. So beat your own conversion rate (the right frame) by doing systematic CRO, finding and fixing your specific barriers, improving the high-impact areas, optimising underperforming segments, improving traffic quality too, testing and measuring, and iterating continuously. This — improving your own rate over time through CRO — is what grows your business (more sales from your traffic), far more meaningful than comparing to a generic average. So focus your energy on beating your own rate through CRO, not on the generic benchmark. So the useful answer to “what’s a good conversion rate?” is: understand your own in context, and focus on improving it — which is what CRO does and what grows your business.
A worked example: two stores with the “same” conversion rate
Picture two Shopify stores that both convert at exactly 2% — identical on the headline number, yet the reality behind that number is completely different, which is precisely why a single benchmark is so unhelpful. Store A sells low-priced impulse products and gets most of its traffic from high-intent branded search and email — an easy-to-convert situation. For Store A, 2% is actually poor: given how warm its traffic is and how impulse-friendly its products are, it should be converting much higher, so it’s leaving significant money on the table and has large untapped potential. A generic “2% is average, you’re fine” benchmark would falsely reassure Store A and hide a big opportunity. Store B sells expensive, considered products (a long deliberation, high price) and drives traffic largely from broad, top-of-funnel ads and social — a hard-to-convert situation. For Store B, 2% is strong: converting cold traffic on a high-consideration purchase at that rate is a real achievement, and its potential upside from further conversion work is smaller. A benchmark that told Store B it was “only average” would wrongly make it feel like a failure.
Same 2%, opposite meanings — one underperforming its potential, one excelling for its context. This is the whole argument against fixating on the average: the number in isolation is nearly meaningless, and only context (traffic quality, product, price, audience) makes it interpretable. The useful move for both stores is the same: ignore the generic comparison, understand their rate in context and by segment, compare to their own history, and focus on improving their own rate through CRO. Store A should chase its large potential aggressively; Store B should keep refining but with realistic expectations for its harder context. Both grow their businesses by beating their own rate over time — not by measuring themselves against a benchmark that, as this example shows, can’t distinguish an underperformer from an overachiever. That’s why “understand and beat your own rate” is the answer that actually helps, and “what’s the average?” is the question that doesn’t.
The bottom line
“What’s a good conversion rate?” is a common question, but the honest answer is more nuanced than a single benchmark: conversion rates vary enormously by industry, product type, price point, traffic source and quality, audience, device, and store maturity, so a generic ecommerce average (commonly cited in the low single digits) is of limited use for judging your specific store — a “good” rate for one store can be poor for another, and comparing to a generic average can mislead (feeling good while underperforming your potential, or bad while doing well for your context). What matters far more is understanding your own conversion rate in its context and improving it over time. Your rate reflects your specifics (store, products, price, traffic, audience, execution), your context determines your “right” rate (a considered high-priced purchase from broad traffic will convert lower than a cheap impulse buy from high-intent traffic, both potentially “good” for their context), and improving your own rate over time is what grows your business — so your rate’s trajectory and your potential matter more than a comparison to an average. Judge your conversion rate sensibly by measuring it accurately (via GA4 ecommerce tracking, overall and by segment), looking at it by segment (channel, device, new vs. returning — the most useful view, revealing where conversion is won or lost), comparing to your own history (your trajectory — the most meaningful comparison), using context-appropriate expectations, considering your traffic quality (which heavily influences your rate), focusing on what’s improvable, and not obsessing over the absolute number versus a generic average. Then “beat it” — but the right frame is beating your own rate (improving it over time), not a generic average — through systematic CRO: measure and understand where conversion is lost, research your barriers, hypothesise, prioritise, test, and iterate; find and fix your specific conversion barriers; improve the high-impact areas (product pages, cart/checkout, trust, mobile); optimise your underperforming segments; improve your traffic quality too (a related lever); test and measure your improvements; and keep iterating continuously. Improving your own conversion rate over time through CRO is what grows your business (more sales from your traffic), and it’s far more meaningful and useful than fixating on how you compare to a generic benchmark. So the useful answer to “what’s a good conversion rate?” is: understand your own in context (by segment, over time, given your traffic and products), and focus your energy on improving it — which is exactly what CRO does. Don’t chase the average; understand and beat your own rate.
Frequently asked questions
What is a good conversion rate for a Shopify store?
There’s no single meaningful answer, because conversion rates vary enormously by many factors: industry and product type, price point (considered, high-priced purchases convert lower than cheap impulse buys), traffic source and quality (high-intent traffic like branded search or email converts far higher than broad, cold traffic), audience, device (mobile often converts lower than desktop), and store maturity and brand strength. Generic ecommerce averages are often cited in the low single digits, but this obscures huge variation, so a generic average isn’t a meaningful target for your specific store — a “low” rate might be perfectly good for your context (say, high-priced products from broad traffic), while a “high” rate might still be underperforming your potential. What’s useful is understanding your own rate in your context (by segment, given your traffic and products) and focusing on improving it over time, rather than comparing to a generic benchmark that doesn’t reflect your specifics.
Why aren’t conversion-rate benchmarks more useful?
Because they compare you to a generic average that doesn’t reflect your specific situation, so they tell you little and can mislead. Your “right” conversion rate depends on your industry, products, price point, traffic quality, audience, and device mix — all of which vary enormously — so a generic average isn’t a meaningful target for you. Relying on benchmarks can lead to misjudgment: feeling good about beating an average when you’re actually underperforming your own potential (leaving money on the table), or feeling bad about being below it when you’re actually doing well for your context. Far more useful than a generic average are context-specific comparisons: your rate versus similar stores or your industry (if you have such data), your rate broken down by segment (channel, device), and especially your rate over time compared to your own history — which actually tells you whether you’re improving.
How should I judge my own conversion rate?
Measure it accurately first (via properly-configured GA4 ecommerce tracking), overall and by segment. Then look at it by segment (channel or source, device, new versus returning, key landing pages), since segment rates reveal far more than the overall number — showing which segments convert well or poorly and where the opportunities are. Compare it to your own history (is it improving, stable, or declining?), which is the most meaningful comparison because it shows whether your efforts are working. Use context-appropriate expectations (understanding that your right level depends on your traffic quality, products, and price), and consider your traffic quality and mix, since a “low” overall rate might reflect broad, low-intent traffic rather than poor site conversion. Focus on what’s improvable — the segments, pages, and funnel stages where conversion is lost and could be lifted — rather than obsessing over the absolute number or how it compares to a generic average.
How do I actually improve my conversion rate?
Through systematic conversion rate optimization (CRO), which improves your own rate over time — the right goal (rather than “beating the average”). Measure and understand where conversion is lost (your funnel and segments), research the barriers (analytics, heatmaps, session recordings, customer feedback), form hypotheses, prioritise them, test the changes, and iterate continuously. Focus on your specific conversion barriers (where your visitors actually drop off and which segments underperform) and the high-impact areas — product pages (where buying decisions happen), cart and checkout (where intent converts), trust, and mobile. Optimise your underperforming segments (for example, improving mobile conversion if mobile lags), and recognise that traffic quality also affects your rate (so attracting more high-intent traffic can help alongside site improvements). Test your changes and measure their effect on conversion to validate real improvement, and keep iterating. Improving your own rate over time through CRO is what grows your business — far more meaningful than comparing to a benchmark.