
Shopify Plus Reporting and Analytics
On this page
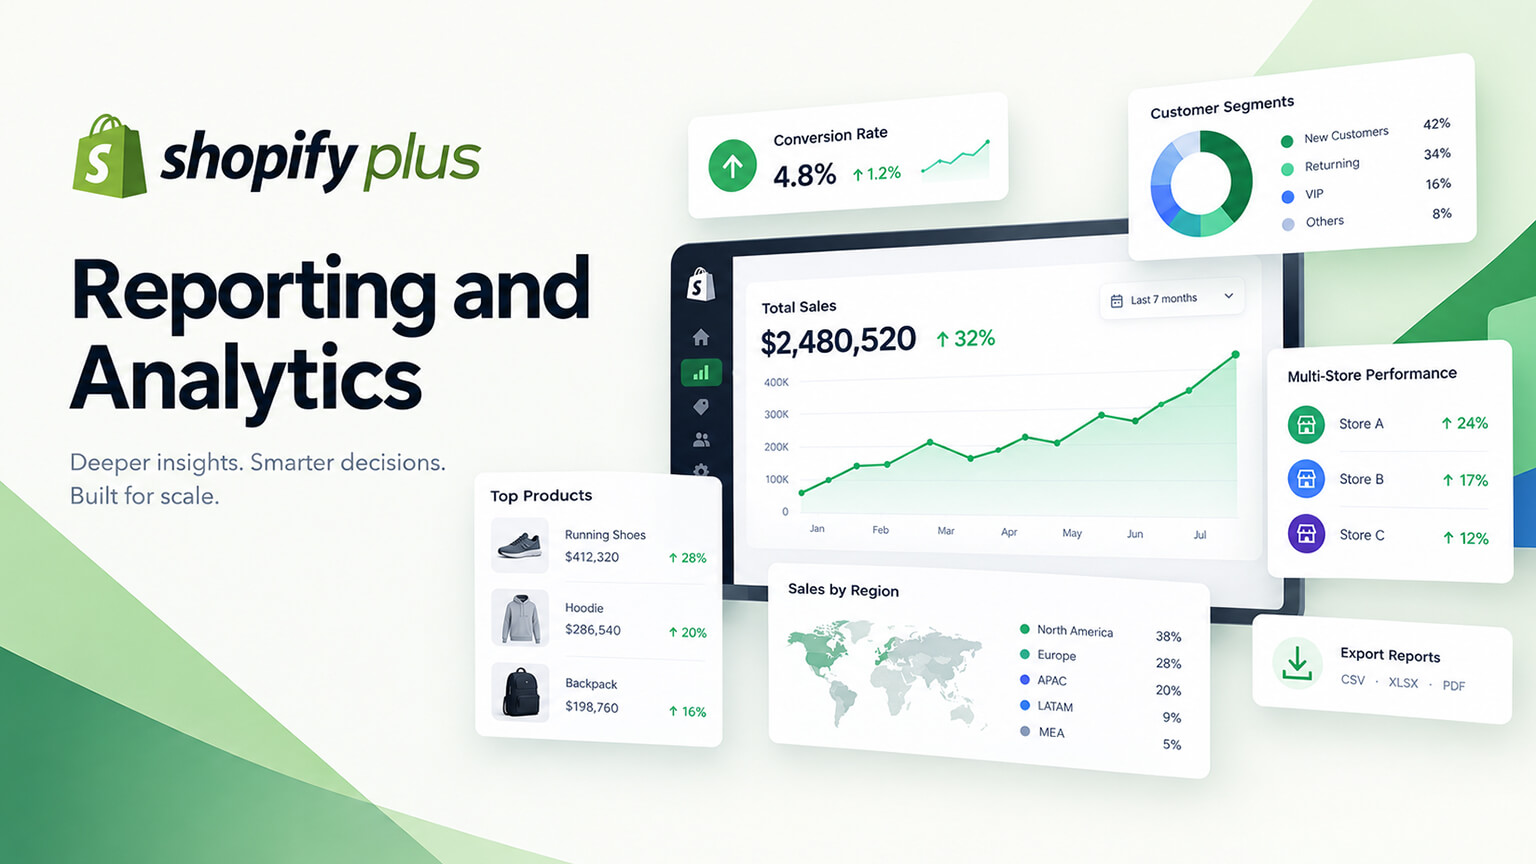
Data-informed decisions depend on good reporting and analytics — understanding your store’s performance, customers, products, and trends (as the metrics discussion covers) — and Shopify Plus offers more advanced reporting and analytics capabilities than standard Shopify, suited to larger, more complex stores that need deeper insight. While all Shopify plans have analytics (and you should also use GA4 and other tools, as the GA4 discussion covers), Plus’s enhanced reporting provides more advanced, customisable, comprehensive reporting for stores that need it (analysing performance, customers, products, and operations in depth at scale). Understanding what Plus’s reporting and analytics offer, what they enable, and how to use reporting well helps you leverage data for decisions at scale. This piece covers Shopify Plus reporting and analytics: what’s available, what it enables, how it compares to standard, and how to use reporting well. (This connects to the metrics and measuring-SEO discussions; this focuses on Plus reporting/analytics. Note: Shopify’s reporting features and structure evolve; this covers the general picture.)
This piece covers what Plus’s reporting and analytics offer, what they enable, how they compare to standard Shopify, and how to use reporting well at scale. Because good reporting informs decisions, and Plus’s enhanced reporting suits larger stores needing deeper insight. Let me walk through it.
What Plus’s reporting and analytics offer
Shopify Plus offers more advanced reporting and analytics than standard plans (the general picture; specifics evolve). More advanced reporting — Plus offers more advanced reporting capabilities than standard Shopify (more report types, more depth, more analysis), suited to stores needing deeper reporting (analysing performance in more detail) — the core (enhanced reporting). Custom reports — Plus enables custom reports (building reports tailored to your needs — custom metrics, dimensions, and views), so you can analyse what matters to you (versus only standard reports) — custom reporting (a key Plus capability). More comprehensive analytics — Plus provides more comprehensive analytics (deeper insight into sales, customers, products, behavior, operations), so larger stores can analyse their performance comprehensively — comprehensive analytics. Advanced report types — Plus includes advanced report types (detailed sales, customer, product, behavior, and other reports beyond standard), enabling deeper analysis — advanced reports. Customer and cohort analysis — Plus’s analytics can include customer and cohort analysis (analysing customer behavior, retention, cohorts, lifetime value, as the retention discussion covers), valuable for understanding customers and retention at scale — customer analytics. Better data access and export — Plus often provides better data access and export (getting your data out for analysis in other tools, integrating with BI/analytics systems), supporting deeper or external analysis — data access. Scale-appropriate analytics — Plus’s reporting suits analysis at scale (larger data volumes, more complex analysis needs), fitting larger stores’ analytics needs — scale-appropriate. And part of Plus’s capabilities — the enhanced reporting is part of Plus’s overall capabilities for larger stores (as the Plus-comparison discussion covers), fitting Plus’s positioning (more capability for bigger stores) — part of Plus. So Plus’s reporting and analytics offer more advanced reporting (more types, depth, analysis), custom reports (tailored to your needs), more comprehensive analytics (deeper insight into sales, customers, products, behavior), advanced report types, customer and cohort analysis, better data access and export, and scale-appropriate analytics — enhanced reporting suited to larger stores needing deeper insight. So Plus provides more advanced, customisable, comprehensive reporting than standard, for stores needing it. So Plus’s enhanced reporting offers deeper, customisable analytics for larger stores. The next section covers what it enables. So Plus offers more advanced, custom, comprehensive reporting and analytics suited to larger stores’ deeper insight needs.
What it enables
Plus’s enhanced reporting and analytics enable deeper, data-informed understanding and decisions. Deeper performance understanding — the enhanced reporting enables deeper understanding of your performance (sales, revenue, trends, in more detail and custom views), so you understand your performance comprehensively (versus surface metrics) — deeper insight. Custom analysis for your needs — custom reports enable analysing what specifically matters to your business (custom metrics, dimensions, views), so you get the insights relevant to your decisions (versus only standard reports) — tailored analysis. Customer and retention insight — customer and cohort analysis enables understanding your customers and retention deeply (behavior, cohorts, retention, LTV, as the retention discussion covers), valuable for retention/LTV decisions (where much profit is, as that discussion covers) — customer insight (supporting retention). Product and merchandising insight — detailed product analytics enable understanding product performance (what sells, product trends, as the merchandising discussion touches on), informing merchandising and inventory decisions — product insight. Data-informed decisions at scale — the comprehensive analytics enable data-informed decisions at scale (understanding performance, customers, products, operations to inform strategy and decisions), so larger stores can make data-driven decisions with good insight — data-informed decisions. Identifying trends and opportunities — the reporting helps identify trends, patterns, and opportunities (in sales, customers, products), informing where to focus and act — spotting opportunities. Integration with BI/external analytics — better data access enables integrating with BI tools or external analytics (for even deeper or specialised analysis), so larger stores can build sophisticated analytics (beyond Shopify’s, using their data) — external analytics. And supporting data-driven operations — collectively, the enhanced reporting supports data-driven operations and strategy at scale (informed by comprehensive performance, customer, and product insight), fitting larger stores’ data needs — data-driven operations. So Plus’s reporting and analytics enable deeper performance understanding, custom analysis for your needs, customer and retention insight (supporting retention/LTV), product and merchandising insight, data-informed decisions at scale, identifying trends and opportunities, integration with BI/external analytics, and supporting data-driven operations — deeper, tailored, comprehensive data-informed understanding for larger stores. So Plus’s reporting enables the deeper, data-informed understanding and decisions larger stores need. The next section covers how it compares to standard. So Plus’s reporting enables deeper, custom, comprehensive data-informed understanding and decisions at scale.
How it compares to standard (and other tools)
Let’s place Plus’s reporting in context (versus standard Shopify and other analytics tools). More than standard Shopify — standard Shopify has analytics and reports (decent for many stores), but Plus offers more (advanced reporting, custom reports, more comprehensive analytics, customer/cohort analysis, better data access) — so Plus’s reporting is more advanced than standard’s (for stores needing more) — the comparison (Plus > standard reporting). Standard is sufficient for many — standard Shopify’s analytics are sufficient for many stores (their reporting needs met by standard reports plus GA4), so not every store needs Plus’s enhanced reporting — a caveat (standard suffices for many). Use alongside GA4 and other tools — regardless of plan, you should also use GA4 (as the GA4 and measuring-SEO discussions cover) and potentially other analytics tools, since Shopify’s analytics (standard or Plus) are part of your analytics stack (alongside GA4 for web analytics, and other tools) — so Plus reporting complements (not replaces) GA4 and other tools — the analytics stack (Shopify + GA4 + others). Plus for deeper Shopify-native reporting — Plus’s value is deeper Shopify-native reporting (custom reports, comprehensive analytics, customer/cohort analysis within Shopify), useful for stores wanting more from Shopify’s own analytics (beyond standard) — Plus’s niche (deeper native reporting). BI tools for the most advanced — for the most advanced analytics, larger stores use BI tools (Looker, Tableau, etc.) or data warehouses (analysing their data comprehensively, integrating multiple sources), which Plus’s better data access supports (getting data out) — so BI tools are the top tier (Plus data feeding them) — BI for advanced. Match to your needs — match your reporting/analytics to your needs: standard Shopify plus GA4 for many stores; Plus’s enhanced reporting for stores needing deeper Shopify-native reporting; BI tools for the most advanced analytics — so use the reporting/analytics appropriate to your scale and needs — matching. And it’s one factor in the Plus decision — Plus’s enhanced reporting is one factor (among many) in the Plus decision (as the Plus-comparison and when-to-upgrade discussions cover): relevant if you need deeper reporting, but one of many Plus benefits — so weigh it appropriately (relevant if you need it) — a Plus factor. So Plus’s reporting compares to standard as more advanced (custom reports, comprehensive analytics, customer/cohort analysis — for stores needing more, while standard suffices for many), complements GA4 and other tools (part of your analytics stack, not replacing them), provides deeper Shopify-native reporting (Plus’s niche), with BI tools for the most advanced analytics (Plus’s data access feeding them) — so match your reporting/analytics to your needs and scale, and weigh Plus’s reporting as one factor in the Plus decision. So Plus’s reporting is more advanced than standard (for stores needing deeper native reporting), used alongside GA4 and BI tools, matched to your needs. The next section covers using reporting well. So Plus’s reporting is more advanced than standard, complements GA4 and BI tools, and is matched to your needs and scale.
How to use reporting well at scale
Using reporting and analytics well at scale (leveraging Plus’s capabilities and your analytics stack) involves focusing on the right metrics and insights for decisions. Focus on the metrics that matter — focus on the metrics that matter (conversion, revenue, AOV, retention/LTV, the meaningful business metrics, as the metrics discussion covers), not vanity metrics, so your reporting informs real decisions (versus drowning in data) — meaningful metrics (as that discussion covers). Use reporting for decisions — use reporting to inform decisions (understanding performance, customers, products, trends to guide strategy and action), so the analytics drive decisions (versus reporting for its own sake) — decision-focused (the point of reporting). Leverage custom reports for your needs — leverage Plus’s custom reports to analyse what specifically matters to your business (your key metrics, questions, views), getting the insights relevant to your decisions — tailored to your needs. Use customer and cohort analysis for retention — use customer and cohort analysis (Plus’s capability) to understand customers and retention (behavior, cohorts, LTV, as the retention discussion covers), informing retention/LTV strategy (where much profit is) — leveraging customer analytics. Combine your analytics stack — combine your analytics (Shopify/Plus reporting, GA4, BI tools, as those discussions cover) into a coherent view, so you have comprehensive, reliable analytics (each tool’s strengths) — using the stack well. Ensure accurate data — ensure your analytics are accurate (correct tracking, reliable data, as the GA4 discussion emphasises), since decisions depend on accurate data (inaccurate analytics mislead) — accuracy (as the GA4 discussion covers). Track trends over time — track key metrics and trends over time (performance trajectory, changes, as the metrics discussion covers), understanding your performance’s direction (versus snapshots) — trend-tracking. Turn insight into action — turn the insights into action (using what you learn to improve — CRO, merchandising, retention, marketing, as those discussions cover), since reporting’s value is in the actions it informs (versus insight not acted on) — action (the payoff). Right-size the analytics — right-size your reporting/analytics to your scale and needs (standard + GA4, Plus’s enhanced reporting, or BI tools, as covered), not over- or under-investing — matching (as covered). And make it ongoing — use reporting ongoing (regularly reviewing performance, monitoring, informing continuous decisions, as the metrics and continuous-CRO discussions cover), so it continuously informs your business — ongoing use. So use reporting well at scale by focusing on the metrics that matter (not vanity metrics), using reporting for decisions (decision-focused), leveraging custom reports for your needs, using customer and cohort analysis for retention, combining your analytics stack coherently, ensuring accurate data, tracking trends over time, turning insight into action (the payoff), right-sizing the analytics to your needs, and using it ongoing. The keys are focusing on meaningful metrics for decisions, leveraging Plus’s custom and customer analytics, ensuring accuracy, and turning insight into action. So use your reporting and analytics (Plus’s enhanced capabilities plus your stack) to inform decisions with accurate, meaningful, actionable insight at scale. So use reporting well by focusing on meaningful metrics, leveraging Plus’s capabilities, ensuring accuracy, and turning insight into action for decisions. So use Plus’s reporting (and your analytics stack) well by focusing on meaningful metrics, leveraging its capabilities, and turning accurate insight into action.
The bottom line
Data-informed decisions depend on good reporting and analytics — understanding your store’s performance, customers, products, and trends — and Shopify Plus offers more advanced reporting and analytics than standard Shopify, suited to larger, more complex stores needing deeper insight. While all Shopify plans have analytics (and you should also use GA4 and other tools), Plus’s enhanced reporting provides more advanced, customisable, comprehensive reporting: more advanced report types and depth, custom reports (tailored to your metrics, dimensions, and views), more comprehensive analytics (deeper insight into sales, customers, products, behavior, and operations), customer and cohort analysis (behavior, retention, cohorts, lifetime value), better data access and export (for external and BI analysis), and scale-appropriate analytics for larger data volumes and complex needs. This enables deeper performance understanding, custom analysis for your specific needs, customer and retention insight (supporting the retention and lifetime value where much profit is), product and merchandising insight, data-informed decisions at scale, identifying trends and opportunities, integration with BI or external analytics tools, and supporting data-driven operations and strategy. Compared to standard Shopify — whose analytics are sufficient for many stores — Plus’s reporting is more advanced (for stores needing deeper Shopify-native reporting), but it complements rather than replaces GA4 and other analytics tools (which you should use regardless of plan as part of your analytics stack), with BI tools (Looker, Tableau, data warehouses) being the top tier for the most advanced analytics (fed by Plus’s better data access) — so match your reporting and analytics to your scale and needs (standard plus GA4 for many, Plus’s enhanced reporting for deeper native reporting, BI tools for the most advanced), and weigh Plus’s reporting as one factor among many in the Plus decision. Use reporting well at scale by focusing on the metrics that matter (conversion, revenue, AOV, retention/LTV — meaningful business metrics, not vanity metrics), using reporting to inform decisions (decision-focused, not reporting for its own sake), leveraging Plus’s custom reports for your specific needs, using customer and cohort analysis for retention and LTV insight, combining your analytics stack (Shopify/Plus, GA4, BI tools) into a coherent view, ensuring accurate data (since decisions depend on it), tracking key metrics and trends over time, turning insight into action (the payoff — using what you learn to improve CRO, merchandising, retention, and marketing), right-sizing your analytics to your scale and needs, and using it on an ongoing basis to continuously inform your business. The keys are focusing on meaningful metrics for decisions, leveraging Plus’s custom and customer analytics, ensuring accuracy, and turning insight into action. So leverage Shopify Plus’s enhanced reporting and analytics (alongside GA4 and, for the most advanced needs, BI tools) to inform your decisions with accurate, meaningful, actionable insight at scale — understanding your performance, customers, and products deeply, and turning that insight into the CRO, retention, merchandising, and strategic actions that grow your business. For larger stores needing deeper insight, Plus’s enhanced reporting is a valuable capability; used well (meaningful metrics, leveraged capabilities, accurate data, insight turned into action), it supports the data-driven decisions that drive growth at scale.
Frequently asked questions
What reporting and analytics does Shopify Plus offer?
Shopify Plus offers more advanced reporting and analytics than standard Shopify, suited to larger, more complex stores. This includes more advanced report types and depth, custom reports (letting you build reports tailored to your specific metrics, dimensions, and views rather than only standard reports), more comprehensive analytics (deeper insight into sales, customers, products, behavior, and operations), customer and cohort analysis (analysing customer behavior, retention, cohorts, and lifetime value), better data access and export (for analysing your data in other tools or integrating with BI and analytics systems), and scale-appropriate analytics for larger data volumes and more complex analysis needs. This enhanced reporting is part of Plus’s broader capabilities for larger stores. That said, you should still use GA4 and potentially other analytics tools regardless of plan, since Shopify’s own analytics (standard or Plus) are part of a broader analytics stack — Plus’s reporting complements rather than replaces GA4 and, for the most advanced analytics, BI tools. Verify current specifics, as Shopify’s reporting features evolve.
What does Plus’s enhanced reporting enable?
Deeper, more tailored, data-informed understanding and decisions. It enables deeper understanding of your performance (sales, revenue, and trends in detail and custom views), custom analysis of what specifically matters to your business (via custom reports), and — valuably — customer and cohort analysis for understanding your customers and retention deeply (behavior, cohorts, lifetime value), which supports the retention and lifetime-value decisions where much ecommerce profit lies. It enables product and merchandising insight (understanding what sells and product trends), data-informed decisions at scale (making strategy and operational decisions with comprehensive insight), and identifying trends and opportunities in your data. Its better data access enables integrating with BI tools or external analytics for even deeper or specialised analysis. Collectively, it supports data-driven operations and strategy at scale — the kind of comprehensive, tailored insight larger stores need to make good decisions about conversion, retention, merchandising, inventory, and strategy, rather than relying on surface-level metrics. The value is turning that deeper insight into better-informed decisions and actions.
How does Plus reporting compare to standard Shopify and other tools?
Plus’s reporting is more advanced than standard Shopify’s — with custom reports, more comprehensive analytics, and customer/cohort analysis — for stores that need deeper Shopify-native reporting. But standard Shopify’s analytics are sufficient for many stores (their needs met by standard reports plus GA4), so not everyone needs Plus’s enhanced reporting. Importantly, regardless of plan, you should also use GA4 (for web analytics) and potentially other tools, since Shopify’s analytics are part of a broader analytics stack — Plus’s reporting complements these rather than replacing them. For the most advanced analytics, larger stores use BI tools (like Looker or Tableau) or data warehouses to analyse their data comprehensively and integrate multiple sources, which Plus’s better data access supports (by getting your data out). So think of it as tiers: standard Shopify plus GA4 suits many stores; Plus’s enhanced reporting adds deeper Shopify-native reporting for stores that need it; and BI tools are the top tier for the most sophisticated analytics. Match your reporting and analytics to your scale and needs, and treat Plus’s reporting as one factor among many in the Plus decision.
How do I use reporting and analytics well at scale?
Focus on decisions and meaningful metrics, not data for its own sake. Track the metrics that matter (conversion, revenue, average order value, retention and lifetime value — the meaningful business metrics) rather than vanity metrics, and use your reporting to inform real decisions and actions. Leverage Plus’s custom reports to analyse what specifically matters to your business, and use its customer and cohort analysis to understand customers and retention (informing the retention and lifetime-value strategy where much profit lies). Combine your analytics stack — Shopify/Plus reporting, GA4, and any BI tools — into a coherent view, and ensure your data is accurate (since decisions depend on reliable data, and inaccurate analytics mislead). Track key metrics and trends over time to understand your trajectory, and — crucially — turn insight into action, using what you learn to improve your CRO, merchandising, retention, and marketing (reporting’s value is in the actions it informs, not the reports themselves). Right-size your analytics to your scale and needs, and use reporting on an ongoing basis to continuously inform your business. The keys are meaningful metrics, leveraging the capabilities, accurate data, and turning insight into action.