
How to Read A/B Test Results Without Fooling Yourself
On this page
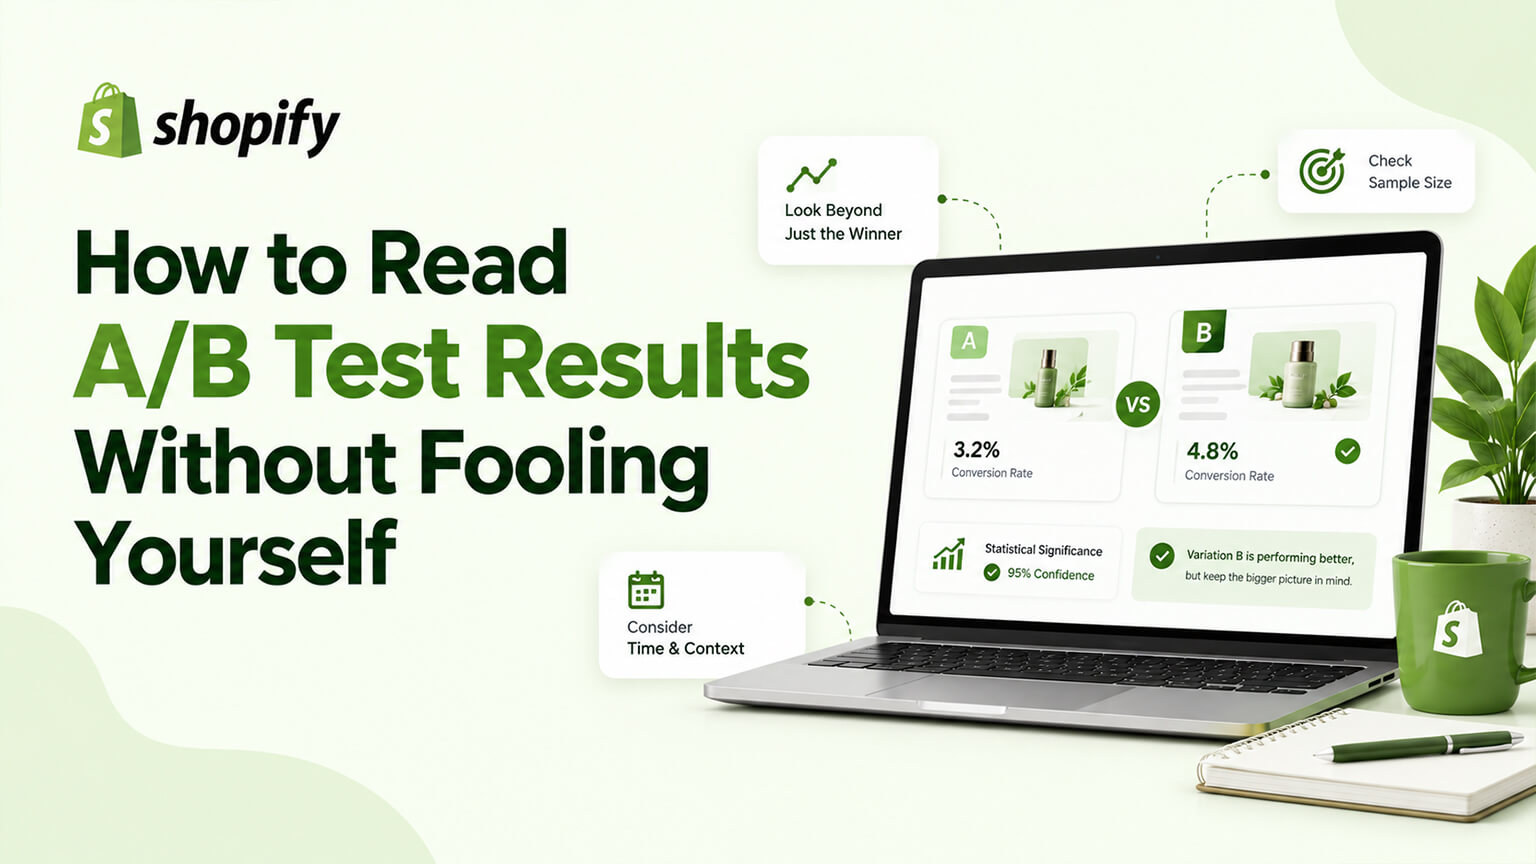
A/B testing is only as valuable as your ability to read its results correctly — and reading A/B test results is deceptively easy to get wrong. It’s tempting to look at a test, see one variation ahead, and declare a winner — but that intuition fools you constantly, because test results are noisy, and apparent differences are often just random variation, not real effects. Acting on misread results is worse than not testing: you implement changes that don’t actually help (or that hurt), waste effort, and build a false understanding of what works — undermining the whole point of testing. The discipline of reading results correctly — understanding statistical significance, sample size, and the traps that fool people — is what separates testing that reliably improves conversion from testing that produces confident-but-wrong conclusions. This piece covers how to read A/B test results without fooling yourself: why it’s easy to get wrong, the key concepts (significance, sample size), the common traps, and how to read results correctly. (This connects to the A/B-testing and CRO-guide discussions; this focuses specifically on reading results without fooling yourself.)
This piece covers why reading results is easy to get wrong, the key statistical concepts you need, the common traps that fool people, and how to read results correctly. Because misreading results undermines testing, and reading them correctly is what makes testing reliably valuable. Let me walk through it.
Why reading results is easy to get wrong
Reading A/B test results is easy to get wrong because of how test data behaves and how intuition misleads. Results are noisy — A/B test results are noisy: conversion rates fluctuate randomly (chance variation), so at any moment one variation may be ahead by chance, not because it’s actually better — the data is noisy, and apparent differences are often noise. Intuition sees patterns in noise — human intuition sees patterns and draws conclusions from noise (seeing a “winner” in what’s actually random variation), so looking at a test and declaring a winner based on an apparent lead fools you constantly — intuition isn’t reliable for reading noisy test data. Small differences and samples deceive — small apparent differences (a variation slightly ahead) and small samples (not enough data) are especially deceptive (likely to be noise, not real effects), so early or small-sample results are unreliable — yet tempting to act on. Wanting a result biases you — you often want a result (hoping your change worked), which biases you toward seeing a positive result (confirmation bias) — making you more likely to fool yourself. The concepts are unintuitive — the statistical concepts that determine whether a result is real (significance, sample size, as covered next) are unintuitive, so without understanding them, people misread results (declaring winners that aren’t real) — the statistics aren’t intuitive. And the traps are common — there are common traps (stopping tests early, peeking, testing many things, as covered next) that lead to false conclusions, and people fall into them easily. So reading results is easy to get wrong because results are noisy (apparent differences often random), intuition sees patterns in noise (declaring false winners), small differences and samples deceive, wanting a result biases you, the statistical concepts are unintuitive, and the common traps are easy to fall into. So reading results reliably requires discipline and understanding (not intuition), covered next. So don’t trust intuition on test results — understand the concepts and avoid the traps to read them correctly. The next section covers the key concepts.
The key concepts (significance, sample size)
Reading results correctly requires understanding a few key statistical concepts. Statistical significance — statistical significance measures the likelihood that an observed difference between variations is real (not due to chance): a “statistically significant” result (typically at a chosen confidence level, e.g., 95%) means the difference is unlikely to be just random variation (so probably a real effect). You need statistical significance to conclude a variation is better (versus an apparent difference that could be noise) — the core concept for reading results (don’t declare a winner without significance). Sample size — you need a sufficient sample size (enough visitors/conversions per variation) for a test to detect a real difference reliably: too small a sample gives unreliable results (differences could be noise), so tests need enough data (sample size) to reach reliable conclusions — you can calculate the sample size needed (based on your traffic, baseline conversion, and the effect size you want to detect). Insufficient sample = unreliable — a test with insufficient sample (too little data) can’t give a reliable result (differences are likely noise), so you must run tests until they have enough data (not conclude early on small samples). Confidence level — the confidence level (e.g., 95%) is the threshold for significance (how confident you want to be the result is real); higher confidence requires more data but reduces false positives. Test duration — tests should run long enough (to gather sufficient sample and account for variation over time — days of the week, etc.), so run for an adequate duration (not stopping early), a practical aspect of getting enough data. And effect size and power — the effect size (how big a difference) and statistical power (the test’s ability to detect a real effect) matter: small effects need larger samples to detect reliably. So the key concepts are statistical significance (the difference is unlikely to be chance — needed to conclude a real effect), sample size (enough data for a reliable result — insufficient samples give unreliable results), confidence level (the significance threshold), test duration (running long enough for sufficient data and time-variation), and effect size/power. These concepts determine whether a result is real (significant, sufficient sample) versus noise. So understand and apply these concepts — especially significance and sample size — to read results correctly (concluding a winner only with statistical significance and sufficient sample). So use these concepts (significance, sample size) to judge whether a result is real, not intuition. The next section covers the common traps.
The common traps that fool people
Several common traps lead to misreading A/B test results — knowing them helps you avoid them. Stopping tests early (peeking) — the biggest trap: stopping a test as soon as it looks significant (or looks like a winner), or “peeking” and stopping when you see a result you like — this dramatically increases false positives (because with enough peeking, noise will at some point look significant), so tests must run to their predetermined sample size/duration (not stopped early when they look good) — a critical trap to avoid. Insufficient sample size — concluding on too little data (small samples, differences likely noise), a common trap — ensure sufficient sample before concluding. Ignoring significance — declaring a winner based on an apparent lead without checking statistical significance (intuition, not statistics), a common error — require significance. Testing many things and cherry-picking — running many tests or variations and cherry-picking the ones that look positive (multiple comparisons increase false positives — some will look significant by chance) — account for this (more tests = more false positives to guard against). Confirmation bias — seeing the result you wanted (your change “worked”) and concluding it’s real without rigour, a bias to guard against with objective criteria. Ignoring the losers/no-effect — only counting positive results and ignoring that many tests show no effect or a negative (which is normal and informative) — read all results honestly (a no-effect or negative result is a valid, informative outcome). Not accounting for variation — not accounting for variation over time (day-of-week, seasonality) by running too short, so the result reflects a non-representative period — run adequate duration. And misinterpreting the metric — misreading which metric matters (e.g., a variation improving clicks but not conversion/revenue) or a false signal in a secondary metric — focus on the meaningful metric (conversion/revenue, as the metrics discussion covers). So the common traps are stopping tests early/peeking (the biggest — dramatically increasing false positives), insufficient sample size, ignoring significance (intuition over statistics), testing many things and cherry-picking (multiple comparisons), confirmation bias, ignoring no-effect/negative results, not accounting for time variation, and misinterpreting the metric. Avoiding these traps — running to predetermined sample/duration, requiring significance, guarding against bias and multiple comparisons, reading all results honestly — is central to not fooling yourself. So know and avoid these traps (especially stopping early and ignoring significance) to read results without fooling yourself. The next section covers reading results correctly.
How to read results correctly
Reading A/B test results correctly brings the concepts and trap-avoidance together into disciplined practice. Predetermine the sample size and duration — before running a test, determine the sample size and duration needed (based on your traffic, baseline, and target effect), and run the test to that (not stopping early) — so you gather enough data and avoid the peeking/early-stopping trap. This is foundational. Require statistical significance — conclude a variation is a winner only when the result is statistically significant (at your confidence level, e.g., 95%) with sufficient sample — not on an apparent lead alone — requiring significance before acting. Run the full duration — run the test for the full predetermined duration/sample (not stopping when it looks good), accounting for time variation and gathering enough data — resisting the urge to peek and stop early. Use proper tools/calculators — use A/B testing tools and significance calculators (that compute significance and sample size properly) to assess results rigorously (versus eyeballing) — leveraging proper statistical assessment. Read all results honestly — read all results honestly (positive, no-effect, negative), accepting that many tests show no effect (normal and informative), not cherry-picking positives — honest reading of what the data shows. Focus on the meaningful metric — judge results by the meaningful metric (conversion, revenue, as the metrics discussion covers), not secondary or vanity metrics that could mislead. Guard against bias — guard against confirmation bias (wanting your change to work) by applying objective criteria (significance, sample) regardless of what you hoped — objective, not wishful, reading. Account for multiple comparisons — if testing many things, account for the increased false-positive risk (more rigorous thresholds, or awareness), not cherry-picking from many tests. And learn from all results — learn from all results (wins, no-effects, losses — each teaches you, as the hypothesis discussion covers), building genuine understanding (versus only counting wins). So read results correctly by predetermining sample size and duration (and running to it), requiring statistical significance with sufficient sample, running the full duration (not stopping early), using proper tools/calculators, reading all results honestly, focusing on the meaningful metric, guarding against confirmation bias, accounting for multiple comparisons, and learning from all results. The keys are running to predetermined sample/duration (not stopping early — the biggest trap), requiring significance (not intuition), and reading honestly and objectively. So apply this discipline — significance, sufficient sample, full duration, honest objective reading — to read A/B test results correctly, so your testing reliably identifies real effects (not noise). So reading results correctly is a discipline (concepts + trap-avoidance) that makes A/B testing reliably valuable — turning tests into trustworthy conclusions rather than confident-but-wrong ones.
The bottom line
A/B testing is only as valuable as your ability to read its results correctly, and reading A/B test results is deceptively easy to get wrong — it’s tempting to see one variation ahead and declare a winner, but that intuition fools you constantly, because test results are noisy and apparent differences are often just random variation, not real effects. Acting on misread results is worse than not testing: you implement changes that don’t help (or hurt), waste effort, and build a false understanding of what works. Reading results is easy to get wrong because results are noisy (apparent differences often random), intuition sees patterns in noise (declaring false winners), small differences and samples deceive, wanting a result biases you (confirmation bias), the statistical concepts are unintuitive, and the common traps are easy to fall into. Reading results correctly requires understanding key concepts: statistical significance (the likelihood a difference is real, not chance — you need significance, typically at 95% confidence, to conclude a real winner), sample size (enough data for a reliable result — insufficient samples give unreliable results, so calculate and reach the needed sample), confidence level (the significance threshold), test duration (running long enough for sufficient data and to account for time variation), and effect size and power. And it requires avoiding the common traps: stopping tests early or “peeking” (the biggest trap — dramatically increasing false positives, so run to predetermined sample/duration), insufficient sample size, ignoring significance (intuition over statistics), testing many things and cherry-picking positives (multiple comparisons increasing false positives), confirmation bias, ignoring no-effect or negative results (which are normal and informative), not accounting for time variation, and misinterpreting the metric (focus on conversion/revenue, not secondary metrics). Read results correctly by predetermining the sample size and duration and running to it (not stopping early — foundational), requiring statistical significance with sufficient sample before declaring a winner, running the full duration, using proper tools and significance calculators (versus eyeballing), reading all results honestly (accepting no-effects and losses as normal and informative), focusing on the meaningful metric, guarding against confirmation bias with objective criteria, accounting for multiple comparisons, and learning from all results. The keys are running to predetermined sample and duration (not stopping early — the biggest trap), requiring significance (not intuition), and reading honestly and objectively. This discipline — understanding the concepts and avoiding the traps — is what separates testing that reliably improves conversion from testing that produces confident-but-wrong conclusions. So don’t trust intuition on A/B test results; apply the discipline of significance, sufficient sample, full duration, and honest objective reading, and your testing will reliably identify real effects rather than fooling you with noise — which is what makes A/B testing valuable for improving conversion.
Frequently asked questions
Why is it so easy to misread A/B test results?
Because test results are noisy and human intuition is bad at reading noise. Conversion rates fluctuate randomly, so at any given moment one variation may be ahead purely by chance, not because it’s actually better — and our intuition sees patterns and “winners” in what’s really just random variation. Small apparent differences and small samples are especially deceptive (likely to be noise, not real effects), yet they’re tempting to act on. You also often want a result (hoping your change worked), which biases you toward seeing a positive outcome (confirmation bias). And the statistical concepts that actually determine whether a result is real — significance, sample size — are unintuitive, so without understanding them, people declare winners that aren’t real. On top of this, there are common traps (like stopping tests early) that lead to false conclusions and are easy to fall into. So reading results reliably requires discipline and statistical understanding rather than intuition, which is exactly why it’s easy to get wrong.
What is statistical significance, and why does it matter?
Statistical significance measures the likelihood that an observed difference between your variations is real rather than due to chance. A statistically significant result (typically at a chosen confidence level like 95%) means the difference is unlikely to be just random variation, so it’s probably a real effect. It matters because A/B test data is noisy — an apparent difference between variations could easily be random noise rather than a genuine effect — so you need statistical significance to conclude that one variation is better. Declaring a winner based on an apparent lead without checking significance is one of the most common ways people fool themselves, because that lead may well be noise. Significance (combined with a sufficient sample size) is what tells you whether a result is trustworthy. So the rule is: don’t declare a winner without statistical significance and enough data — an apparent difference alone isn’t enough.
What’s the biggest mistake people make reading A/B tests?
Stopping tests early — often called “peeking.” It’s tempting to watch a test and stop it as soon as it looks significant or looks like your preferred variation is winning. But this dramatically increases false positives, because if you keep checking a noisy test, at some point random variation will make a difference look significant even when there’s no real effect — so stopping when you see a result you like systematically fools you. The fix is to determine the needed sample size and duration before running the test, and run it to that predetermined point regardless of what it looks like along the way, rather than stopping when it looks good. Related mistakes include concluding on insufficient data, ignoring significance (going on intuition), and cherry-picking positive results from many tests. But early stopping/peeking is the single biggest and most common trap, and avoiding it — running to a predetermined sample and duration — is central to reading results honestly.
How do I read A/B test results correctly?
Apply discipline rather than intuition. Before running a test, determine the sample size and duration you need (based on your traffic, baseline conversion, and the effect you want to detect), and run the test to that point without stopping early. Conclude that a variation is a winner only when the result is statistically significant (at your confidence level, such as 95%) with a sufficient sample — not based on an apparent lead alone. Run the full predetermined duration (which also accounts for variation like day-of-week effects), and use proper A/B testing tools and significance calculators rather than eyeballing the numbers. Read all results honestly — accept that many tests show no effect or a negative result, which is normal and informative, rather than cherry-picking positives. Judge results by the meaningful metric (conversion or revenue, not secondary or vanity metrics), guard against confirmation bias by applying objective criteria regardless of what you hoped for, account for the increased false-positive risk if you’re running many tests, and learn from every result. This discipline turns testing into trustworthy conclusions rather than confident-but-wrong ones.